Motif scanning tools can be used to predict potential binding sites for different transcription factors by searching DNA sequences for good matches to their corresponding motif models. MotifLab comes bundled with collections of experimentally determined binding motifs from several databases, including TRANSFAC and JASPAR. Novel motifs can also be predicted from sets of sequences with de novo motif discovery tools, or users can define new motifs directly by manually specifying a binding matrix, consensus sequence or explicit list of binding sequences.
Motif properties
The motif type is one of the richest data types in MotifLab in terms of the amount of different information it can contain.A list of standard motif properties are described below. Except for "ID" and "matrix", all of these are optional.
In addition to these, motifs can also have extra user-defined properties.
| Property | Description |
|---|---|
| ID | The ID or identifier of a motif is the same as the name of the motif data object. This is set when the data object is created and can not be changed later. The ID is usually in the form of a database specific identifier (e.g. M00037 or MA0004). |
| Short name | A concise name for the motif; usually an abbreviation of the name of the transcription factor such as "AP-1" or "CREB". Motifs from the TRANSFAC collection have short names on the form "X$yyy_nn" where X is a single letter code denoting a species group (V=vertebrates, I=insects, P=plants, N=nematodes, B=bacteria, F=fungi), yyy is a TF abbreviation and nn is either a quality code, consensus flag or incremental number (for discriminating between different motif models for the same factor). |
| Clean short name† | This is derived from the short name by stripping away the "X$" prefix and "_nn" suffix for TRANSFAC motifs so that only the TF abbreviation remains. |
| Long name | A longer name for the motif; usually the full name of the transcription factor such as "Activator Protein 1" or "cAMP-responsive element binding protein" |
| Names† | This is a list consisting of both the short name and the long name together with the names of all annotated binding factors |
| Presentation name† | This is a concatenation of the ID and the short name, e.g. "M00001-V$MyoD_01". This form is often used to refer to motifs in the GUI since the ID is usually not very informative by itself. |
| Size† | The size of the binding model (i.e. the length of the consensus sequence or number of rows in the binding matrix). |
| Matrix | A representation of the DNA binding sequence of the transcription factor in the form of a matrix model. |
| Consensus | A concise representation of the binding model in the form of an IUPAC consensus sequence, e.g. "sGGrnTTTCC". This property is usually derived from the binding matrix, but it is also possible to assign a new consensus sequence to the motif (in which case the the binding matrix will also be updated to correspond with the new consensus). |
| Matrix type† | This can be either count, frequency or weight depending on the format of the binding matrix |
| Support† | If the matrix is a count matrix this property returns the number of binding sequences that the model was based on (equal to the sum of one row in the matrix). |
| GC-content† | The fractional sum of G's and C's in the binding matrix. Reflects the factor's preference for binding to GC-rich sequences. |
| IC-content† | The information content of a matrix is a measure of its binding specificity which is again inversely related to the number of sequences the that motif will match.
IC-content is usually correlated with motif size (longer motifs match fewer sequences) but more importantly with the amount of variation allowed by the binding motif (more degenerate motifs have lower IC and therefore match more sequences). The IC of a single position i within a motif is calculated with the formula: 2+∑b∈A,C,G,T fb,i log2( fb,i ), where fb,i is the frequency of base b in position i, and the total IC of a motif is the sum over all positions. A position which only allows a specific base has the maximum IC of 2.0 and a position which does not show any preference towards a particular base has the minimum IC of 0. For a motif of length N the IC can thus range from 0 to 2*N (most specific). |
| Factors | Names of transcription factors associated with this motif. This could be a single factor or several related factors. It is also possible to include different aliases and synonyms for the same factor. |
| Classification | A class tag consisting of up to four numbers separated by dots, e.g. "3.5.1.2", where the first number identifies the superclass, the second number the class, the third number the family and the fourth number the subfamily of the transcription factor according to the classification hierarchy introduced by the TRANSFAC database. |
| Class name† | The corresponding name of the class tag. E.g. the class "3.5.1.2" has the name "Myb-like factors". |
| Description | A general description of the motif and its associated transcription factor(s) in free-text. |
| GO | A set of gene ontology terms that describe the transcription factor |
| Organisms | A list of species on which the motif model is based (or a list of species for which the motif model could potentially be relevant). |
| Expression | A list of tissue or cell-types where this transcription factor is known to be active |
| Alternatives | A list of other known motifs that cover the same transcription factor and are thus equivalent to this motif (but not necessarily 100% identical). The TRANSFAC and JASPAR motif collections that come bundled with MotifLab are annotated with known alternatives both within and between the collections. |
| Interactions | A list of other motifs that are known to interact with this motif (or rather, their TFs are known to interact). This information can be used to automatically create Module Collections from known interactions. It is also used by the "Interactions Viewer" tool to highlight binding sites for interacting factors in the vicinity of a selected target binding site. Of the motif collections that come bundled with MotifLab, only TRANSFAC is annotated with this kind of information. |
| Quality | A numeric quality measure ranging from 1 (best) to 6 that reflects the experimental reliability of the protein-DNA or miRNA-RNA interactions whose binding sites form the basis for this motif model.
|
| Part | Describes the portion of the binding recognition sequence required for protein binding and activation that is actually covered by this motif model.
|
† These properties are derived from other properties and can not be altered directly.
Matrix model
The main way the binding motif is modelled in MotifLab is with a position-specific scoring matrix (PSSM), sometimes also called a position count matrix (PCM), position frequency matrix (PFM) or position weight matrix (PWM) depending on its format. This matrix is in the form of an N×4 table where each column represents one of the four DNA bases and each of the rows represent one position in the binding motif.A simple count matrix can be created from a set of binding site sequences (aligned and of equal length) by going through each sequence position in turn, counting the number of times each base letter occurs in that position across all the sites and entering this number into the matrix at the corresponding row and column. For example, a matrix derived from the four 6bp binding sequences "CACGTG,CAGGTG,CACGTG,CACGTT" would look like this:
| A | C | G | T |
|---|---|---|---|
| 0 | 4 | 0 | 0 |
| 4 | 0 | 0 | 0 |
| 0 | 3 | 1 | 0 |
| 0 | 0 | 4 | 0 |
| 0 | 0 | 0 | 4 |
| 0 | 0 | 3 | 1 |
If a matrix is based on a large number of binding sites, the magnitude of the value for a particular base in row i relative to the other bases should approximate well the transcription factor's relative preference towards that base in that position of the binding recognition sequence.
A count matrix can be converted into a frequency matrix by dividing the value of each cell with the total sum of the row so that the combined frequencies of the four bases sum to 1.0 for each position. Such a frequency matrix can be further transformed into a weight matrix by replacing each cell value with the log-ratio log( fi,b / pb ), where fi,b is the frequency of base b in position i and pb is the background probability of observing that base in entire genome. A value of 0 for a base b at position i in a weight matrix thus means that the transcription factor shows no particular preference for that base in that position of the recognition sequence (taking the background distribution into account). A positive value reflects a higher preference for that base relative to the other bases and a negative value reflects a lower preference for that base.
When MotifLab imports motifs from a file, the matrix models will be kept in their original formats, but MotifLab also tries to detect what kind of format this is so that the matrix can be dynamically converted into other formats if necessary.
The rules for determining the format based on the matrix values are:
- If the matrix only contains positive integer numbers it is considered to be a count matrix
- If the matrix contains negative numbers it is considered to be a log-transformed weight matrix
- If all the values are between 0 and 1.0 and each row sums to 1.0 it is considered to be a frequency matrix
- If none of the above rules apply the matrix is considered to be an unnormalized frequency matrix
Consensus model
A secondary way to represent the binding model of a motif is with a consensus string. This is a string of base symbols, one for each position in the binding motif, denoting either single DNA bases or degenerate bases that represent groups of two or more DNA bases with a single symbol.The notation follows the standard suggested by IUPAC:
| Symbol | Represents | Name | Complement |
|---|---|---|---|
| A | A | Adenine | T |
| C | C | Cytosine | G |
| G | G | Guanine | C |
| T | T | Thymine | A |
| R | A or G | Purine | Y |
| Y | C or T | Pyrimidine | R |
| M | A or C | Amino | K |
| K | G or T | Ketone | M |
| W | A or T | Weak | W |
| S | G or C | Strong | S |
| B | C, G or T | Not A | V |
| D | A, G or T | Not C | H |
| H | A, C or T | Not G | D |
| V | A, C or G | Not T | B |
| N | any base | Any | N |
If a motif already has a matrix model, the correponding consensus string will be derived from that matrix in accordance with the rules outlined in the section below. If the motif has a consensus string but not a matrix model, a matrix will be constructed based on the consensus string.
Deriving an IUPAC consensus string from a matrix
- A single base letter (A,C,G,T) is used if the frequency of that base is at least 50% and also at least twice the frequency of any other base
- A double-degenerate letter (m,r,w,s,y,k) is used if the combined frequencies of two bases are at least 75%.
- A triple-degenerate letter (b,d,h,v) is used if one of the bases has a frequency of zero.
- If none of the previous rules apply, the wildcard letter 'n' will be used.
Deriving a matrix from an IUPAC consensus string
| Symbol | A | C | G | T |
|---|---|---|---|---|
| A | 1.0 | 0.0 | 0.0 | 0.0 |
| C | 0.0 | 1.0 | 0.0 | 0.0 |
| G | 0.0 | 0.0 | 1.0 | 0.0 |
| T | 0.0 | 0.0 | 0.0 | 1.0 |
| R | 0.5 | 0.0 | 0.5 | 0.0 |
| Y | 0.0 | 0.5 | 0.0 | 0.5 |
| M | 0.5 | 0.5 | 0.0 | 0.0 |
| K | 0.0 | 0.0 | 0.5 | 0.5 |
| W | 0.5 | 0.0 | 0.0 | 0.5 |
| S | 0.0 | 0.5 | 0.5 | 0.0 |
| B | 0.0 | 0.333 | 0.333 | 0.333 |
| D | 0.333 | 0.0 | 0.333 | 0.333 |
| H | 0.333 | 0.333 | 0.0 | 0.333 |
| V | 0.333 | 0.333 | 0.333 | 0.0 |
| N | 0.25 | 0.25 | 0.25 | 0.25 |
Creating motifs
Motifs are usually generated by motif discovery methods or loaded from pre-defined collections. However, it is also possible to define new motifs manually.
In the GUI, select "Add New ⇒ Motif" from the "Data" menu or press the plus-button in the Motifs Panel and select "Motif" from the drop-down menu. This will bring up the Motif dialog.
The dialog contains multiple tabs where you can enter values for various motif properties. The only required property is the binding motif itself, which can be specified either as a matrix model or a consensus sequence.
Consensus sequences can be entered in IUPAC notation (see above) or as a list of individual binding sequences (separated by any non-letter character). The matrix model will then be created automatically from the consensus sequence.
Note that if you create new motifs that are not part of collections, you must select to display "Motifs" from the drop-down menu in the Motifs Panel in order to see the motifs listed in the panel.
In a protocol you can create new motifs with the new operation as shown below. The argument should be a semicolon-separated list of "property:value" pairs.
Semicolons within property values can be escaped with backslash. If property values are lists the entries should be separated with commas.
MyMotif = new Motif( Property1:value1; Property2:value2; ... ; PropertyN:valueN )
The only required property is the binding motif itself which can be specified either as an IUPAC consensus sequence ("CONSENSUS" property) or as a matrix model (by setting the properties "A", "C", "G" and "T"). Other standard properties include: SHORTNAME, LONGNAME, CLASS, ORGANISMS, PART, ALTERNATIVES, PARTNERS, QUALITY, FACTORS, EXPRESSION, DESCRIPTION and GO-TERMS (these names must be uppercase). All other specified properties are regarded as being non-standard, user-defined properties.
Examples
M00001 = new Motif(CONSENSUS:srACAGGTGkyG ; SHORTNAME:myoD)
# Creates a new motif with a specific matrix model (CACGsG)
# The matrix values can be frequencies (like here) or counts
M00002 = new Motif( A:0.0,1.0,0.0,0.0,0.0,0.0; C:1.0,0.0,1.0,0.0,0.5,0.0;
G:0.0,0.0,0.0,1.0,0.5,1.0; T:0.0,0.0,0.0,0.0,0.0,0.0)
Motif manipulation
MotifLab v2 introduced several functions to derive new motifs based on existing motifs using the extract operation, including functions to reverse complement a motif, trim bases off the ends or even extend the motif with additional bases. These functions can be applied to both single motifs and collections (the syntax is almost identical in the two cases, except that the names of the single motif functions usually contain the word "motif" somewhere). When transforming a single motif in this way, the result must always be assigned to a new explicitly named motif object. However, when the operation is applied to a collection, the original motifs will be replaced with the new transformed motifs unless you specify a "name suffix" that can be used to derive sensible names for all the new motifs.
M00001_RC = extract "reverse motif" from M00001 as Motif
# Reverse complements all motifs in the TRANSFAC_Public motif collection (replacing the originals)
New_Motifs = extract "reverse" from TRANSFAC_Public as Motif Collection
# Takes all the motifs from the TRANSFAC_Public motif collection and creates a reverse complement
# motif for each one. The new motifs have names based on the original motifs with the added suffix "_RC"
# (e.g. the complement of motif M00001 will be called M00001_RC). The original motifs are kept intact.
New_Motifs = extract "reverse; name_suffix=_RC" from TRANSFAC_Public as Motif Collection
The following examples demonstrate all of the motif manipulation functions as applied to a full collection.
Remember to add the ";name_suffix=X" option after the extract function if you want to create new motifs rather than transforming the current.
New_Motifs = extract "reverse" from TRANSFAC_Public as Motif Collection
# Inverts the motifs by reversing the order of the positions (reversing without complementing)
New_Motifs = extract "inverse" from TRANSFAC_Public as Motif Collection
# Randomly reorders all the rows in each binding matrix
New_Motifs = extract "shuffle" from TRANSFAC_Public as Motif Collection
# Rounds all the values in the matrix to the nearest integer value
# This can be useful for cleaning up count matrices with rounding errors
New_Motifs = extract "round" from TRANSFAC_Public as Motif Collection
# Expands each motif by adding the bases 'AAA' to the beginning and 'TTT' to the end.
# Use a star (*) or the number 0 to denote an empty string if you only want to add to one side.
# The resulting motifs will have matrices in frequency format.
New_Motifs = extract "flank:AAA,TTT" from TRANSFAC_Public as Motif Collection
# Trims each motif by removing 3 bases from the beginning and 4 from the end
New_Motifs = extract "trim:3,4" from TRANSFAC_Public as Motif Collection
# Trims degenerate flanks from motifs having a specific core surrounded by bases with high variation
# It works inwards from both ends and removes bases until it encounters a base
# with an IC-content that is greater than or equal to the specified threshold (here 0.5)
New_Motifs = extract "trim flanks:0.5" from TRANSFAC_Public as Motif Collection
Motif tracks
A motif track is a special type of region track where the regions correspond to motif sites. In these tracks the type property of each region site corresponds with the name of a motif. Motif tracks include meta-data properties that specifically tag them as such, and they can be recognized in the Features Panel by having names displayed in boldface font. Also, if you point the mouse at a motif track in this panel, the appearing tooltip will describe the dataset as being a "[Region Dataset, Motif track]".Some operations, like motifDiscovery and motifScanning will always return motif tracks, and if you import a region track from any source, MotifLab will first check if it could potentially be a motif track and mark it as such if at least half of the first ten regions correspond to known motifs. You can also try to manually convert a regular region track into a motif track by right-clicking on a track in the Features Panel and selecting "Convert to Motif Track" from the context-menu.
A motif region or motif site is a region within a motif track that represents the location of a transcription factor binding site by having a type property that corresponds to the name of a known Motif model.
Motif tracks are given special treatment by the GUI's track visualizer, both with respect to how the motif regions themselves are drawn and also how their tooltips are rendered when you point the mouse at a motif region.
Motif match logos
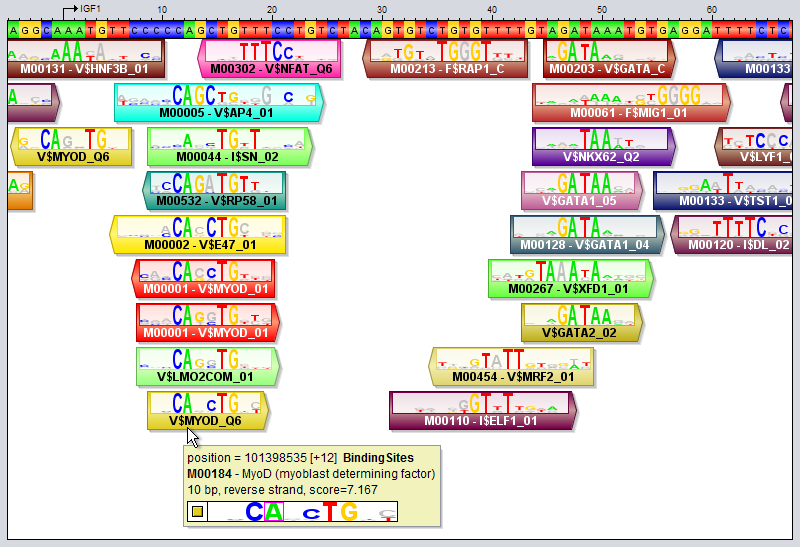
When the track height and zoom level of the sequence in the sequence window allows it, motif regions will be drawn with motif match logos overlayed on top of the regions. These logos illustrate both the model of the motif itself and how well the model matches the DNA sequence at this particular location. They are inspired by the "Sequence logo" concept introduced by Schneider and Stephens ("Sequence logos: a new way to display consensus sequences", Nucleic Acids Research, Oct 1990, 18(20):6097-6100). The logo is created from the matrix model representation of the motif. For each motif position, the letters for the four bases are first drawn on top of each other. They will be sorted according to their frequency in the model, with the most frequent base on top. Each base letter is also scaled according to its frequency, so if e.g. the frequency of base "G" is 0.46, then the height of the letter G will take up 46% of the stack height, originally. Next, the whole stack of four base letters is scaled once again according to information content, so positions with higher information content (i.e. those whose frequency distribution is more skewed towards a single nucleotide) will have a higher stack. On the other hand, positions that have an almost uniform distribution between the four bases will have a very short height. In addition, the matching base at each position will be colored according to its base's preferred color, whereas the other bases will be drawn in a gray color. Consider as an example the motif region for "M00184 - MyoD" that the mouse cursor is pointing at in the image above. In the last position of this site, the motif model has an almost equal preference for the bases C and T, with C slightly preferred over T (since the most frequent base according to the model - here C - is drawn on top). However, the DNA sequence contains a "T" in this position rather than the most preferred base "C", as indicated by the fact that the T is colored red in the logo while the C is gray. The "colorfulness" of the match logo thus gives an indication of how well a motif model actually matches the DNA sequence at that location. The more tall letters drawn in vibrant colors the logo contains, the better the match between the motif and the sequence. Logos with lots of gray, on the other hand, indicate worse matches. It should be noted that the motif logo colors are not based on the match between the motif logo and the DNA track here seen above the motif track. The DNA sequence used when comparing the motif model to the sequence is taken from a property of the region itself, named "sequence" (this property can be inspected by double-clicking on a region). This "sequence" property is usually set automatically in each region when motif tracks are created based on DNA tracks (using motif discovery or motif scanning tools). Regions that lack this "sequence" property will not be drawn with overlayed motif match logos at all.
The visualization of motif sites and their tooltips will differ somewhat depending on whether the motif track is visualized in contracted mode or expanded mode, and the differences between these two modes are described below. You can switch between these modes by selecting a region track in the Features Panel and pressing the X or E keys, or by right-clicking on a track and selecting the mode from the context menu.
Expanded Mode
In expanded mode (shown in the image above), overlapping motif sites will be drawn beneath each other so that every region is clearly separated from the other regions and distinctly visible in the track.
- The "visualize score" option has no effect in this mode. All motif sites are drawn with the same height.
- If the "visualize strand (orientation)" option is enabled, the boxes of motif sites will be drawn with protrusions indicating their orientation (but only in zoom levels 1000% and above)
- The position that the mouse currently points to within the sequence followed by the name of the track (in boldface)
- The name (identifier) of the motif that the mouse is pointing at followed by the "long name" of this motif
- The third line contains additional information about this particular motif site:
- The sequence span (length) of the region (in bp)
- The orientation of the motif site
- The score of the motif site
- The fourth line again shows the motif match logo where the base that the mouse is pointing to in the motif is highlighted with a pink rectangle. In front of the motif logo is a pair of nested boxes, where the outer box is white and the inner box has the color associated with the motif.
Contracted Mode
In contracted mode, all the regions are visualized on the same line and overlapping regions will thus be drawn on top of each other.
- When the "visualize score" option is enabled, the height of the regions will be scaled according to their scores.
- If the "visualize strand (orientation)" option is enabled, the track will be divided into two vertical halves by a middle line. Boxes drawn above this middle line indicate regions that have the same orientation as the orientation that the underlying sequence is currently visualized in. Regions that have the opposite orientation will be drawn with boxes below the middle line. Regions with undetermined orientation are drawn both above and below the line.